在做性能优化的时候, 由于服务器是 Windows, 而看到的好多工具, 像 DTrace 等都是只支持 Linux 的, 虽然 DTrace 微软官方有一个 port, 但是使用体验并不好. 然后, 花了挺多时间去网上搜一些 performance profiling tools的, 后来, 突然意识到自己简直是守着金山要饭. Xperf 就是一个十分好用的工具, 之前由于一次采样的时间过久(20多分钟), 导致文件很大 (10多G), 然后每次打开一个 View 的时间过长, 所以后来就不了了之了.
Introduction
Xperf 的官方文档可以参考这里, 它是 Windows Performance Analyzer (WPA) 里面的一个重要组件, 另一个比较好用的组件是 F1 Profiler, 利用 F1Profiler 可以很方便地看到每一部分的 CPU usage, inclusive 和 exclusive 的, 可以很具体到是哪一个函数,甚至是哪一行用了比较多的CPU.
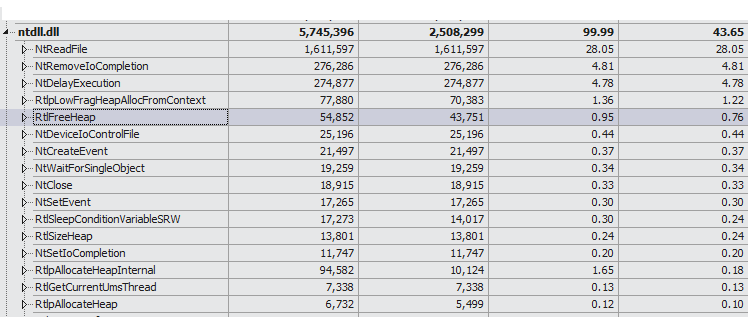
但是 F1Profiler 的一个缺点是由于其是基于统计的信息,所以不能很好的了解一些具体的某些时段发生的事情,另外就是其主要信息是关于 CPU 的采样, 所以对于其余的例如IO方面,内存方面的问题就有些力不从心了. 而基于 event 信息的 xperf,就没有这些问题了.
首先当然是安装, 其包含在Widnows SDK 里面, 只需要在官方SDK网站, 这里下载最新的, 然后安装就可以了.
Start && Stop
用 xperf 来记录信息也十分方便, 只需要
1
| xperf -on FileIO+FILENAME+PROFILE -maxbuffers 1024
|
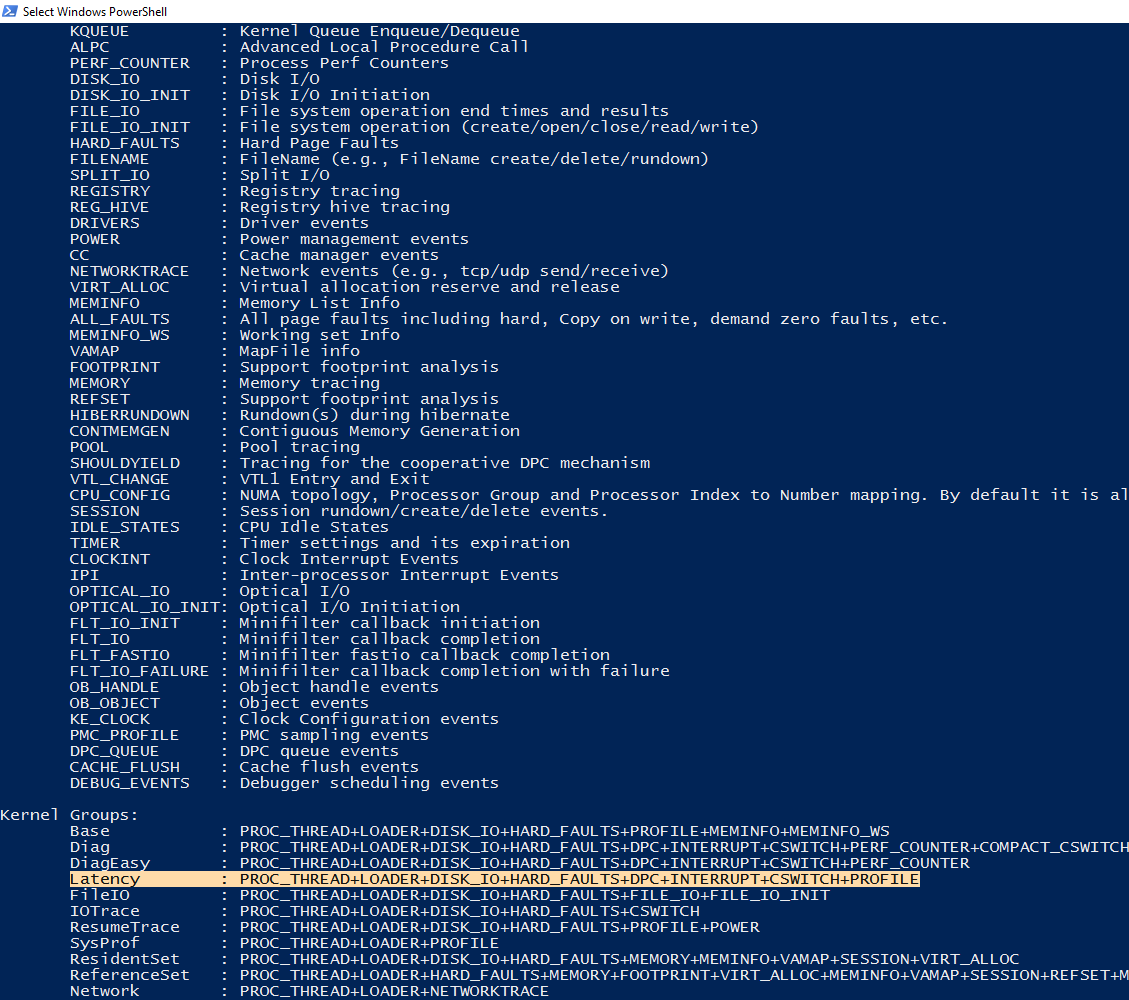
这里其中-on后面的参数是可以根据自己的情况修改的, 具体包含哪些可以通过 xperf -providers KF KG 命令得到. 其中 KF 是所有的 kernal flags, 而 KG 则是一些组合, 例如 Latency 就等价于 PROC_THREAD+LOADER+DISK_IO+HARD_FAULTS+DPC+INTERRUPT+CSWITCH+PROFILE, 一些典型的 Flag.
在 xperf 开始工作之后, 我们就可以启动我们想要 profiling 的应用程序, 由于 xperf 的设计问题, 目前我们不能单独的指定只profile 和某个 process 相关的信息, 所以会得到的相当于那个时间段之内全量的信息. 在采集一段时间后, 我们可以简单的通过 xperf -d D:\xperf_trace_log.etl 来把output 输出到指定路径指定文件.
View
GUI
最简单查看的方式就是直接双击打开, 就会在左侧列出一些小图,你也可以选择一些指定的细节到新建的view里面去。主界面大概是这样子的:
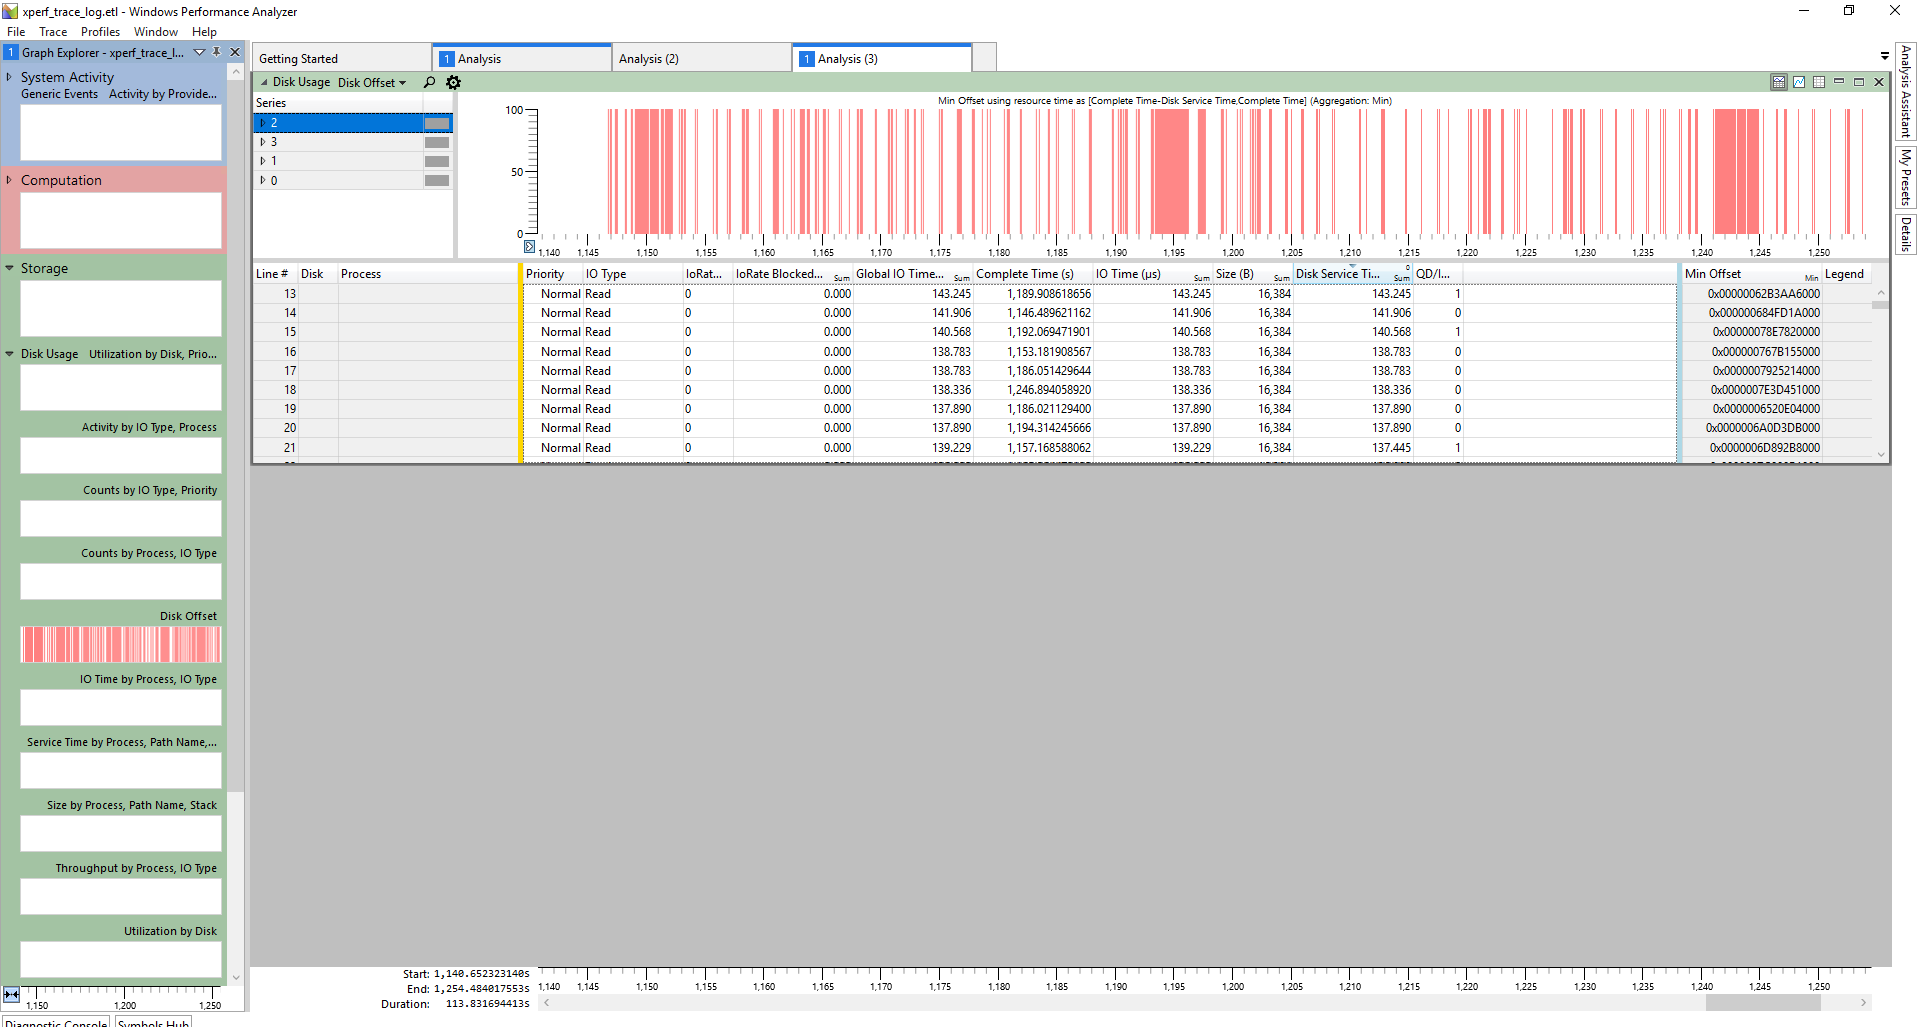
但是这种方式有一些缺点,首先第一个是当数据量很大的时候, 每个图都要等很长一段时间, 尤其是很多图的信息其实并不是你想要的. 另外一个,虽然从他生成的一些图里面可以很明显地看到一些问题, 但是有很多时候, 我们需要自己对这些单条的 event log 做一些分析统计和处理, 显然在 GUI 里面就不是很方便了.
CLI
CLI 命令可以很方便的把我们需要的信息输出出来, 其基本命令格式也很简单,
1
| xperf -i input.etl -o output.txt -a <action_name> [action_parameters]
|
这种形式的命令来获得指定的输出, 例如如果我想得到我们 process1 在时间 [368000000, 866000000], 这里的时间为距离开始的微秒数,这也就是运行了368s到866s之间的信息, 内的CPU disk的信息就可以用下面的命令:
1
| xperf -i input.etl -tle -o cpudisk.txt -a cpudisk -exes process1 -times 368000000 866000000
|
这里我们加了 -tle 的参数, 是因为当长时间的运行的时候, 有的时候会漏掉一些event, 这时候会有下面类似的提示且不实际去执行我们的 action.
1 2 3 4 5 6 7
| 2 Events were lost in this trace. Data may be unreliable. This is usually caused by insufficient disk bandwidth for ETW logging. Please try increasing the minimum and maximum number of buffers and/or the buffer size. Doubling these values would be a good first attempt. Please note, though, that this action increases the amount of memory reserved for ETW buffers, increasing memory pressure on your scenario. See "xperf -help start" for the associated command line options.
|
而加了参数之后就可以正常执行了.
我们也可以通过下面的命令看到很具体的哪些文件被哪些service 访问了, 这个访问的 offset 和 IO的很详细的信息.
1
| xperf -i input.etl -tle -o diskio_detail.txt -a diskio -summary -detail -range 368000000 370000000
|
这样来自-summary这个参数的统计信息:
1 2 3 4 5 6 7 8 9 10
| Count, Size, SrvT, R-Count, R-Size, R-SrvT, W-Count, W-Size, W-SrvT, IOTime, Filename 3, 0, 95410, 0, 0, 0, 0, 0, 0, 95410, "Unknown" 805, 52690944, 175036, 0, 0, 0, 805, 52690944, 175036, 252839, C:\kernel.etl 7, 36864, 7565, 2, 8192, 5587, 5, 28672, 1978, 7877, D:\$Mft 9, 40960, 735, 0, 0, 0, 9, 40960, 735, 7059, C:\$Mft 1, 65536, 439, 0, 0, 0, 1, 65536, 439, 2477, C:\Windows\System32\winevt\Logs\Security.evtx 1, 4096, 87, 0, 0, 0, 1, 4096, 87, 87, D:\$LogFile 2, 8192, 233, 0, 0, 0, 2, 8192, 233, 233, C:\ProgramData\Microsoft\Windows Defender\Support\MpWppTracing-05282020-040703-00000003-ffffffff.bin 2, 208896, 956, 0, 0, 0, 2, 208896, 956, 956, C:\$LogFile 3, 12288, 623, 0, 0, 0, 3, 12288, 623, 3712, C:\$BitMap
|
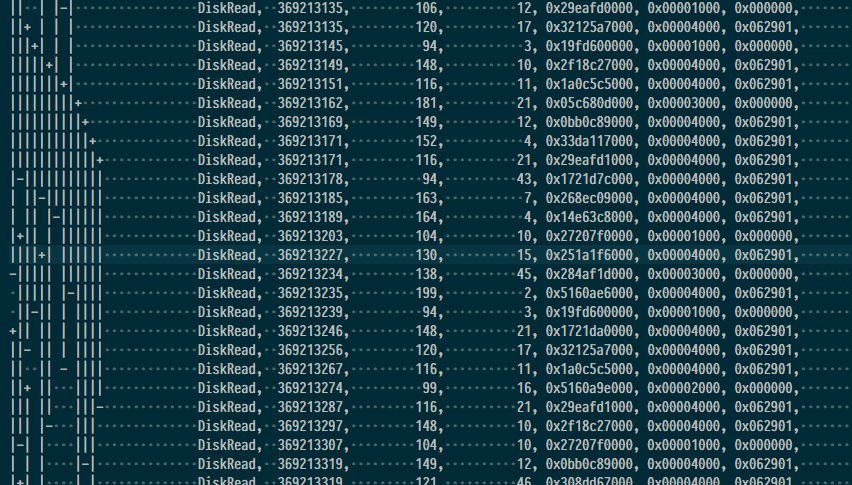
和来自于 -detail 的具体的某一个时间的输出信息:
1 2 3 4 5 6 7 8 9 10 11 12 13 14
| QD/I - Number of outstanding IOs at IO start time. QD/C - Number of outstanding IOs at IO Completion time. IBCB - Number of IOs that initialized before start time and completed before end time. IBCA - Number of IOs that initialized before start time and completed after end time. IACB - Number of IOs that initialized after start time and completed before end time. IO Type, Start Time, End Time, IO Time, Disk SrvT, IO Size, Byte Offset, Pri, QD/I, QD/C, IBCB, IBCA, IACB, Process Name ( PID), Disk, Filename DiskWrite, 368013044, 368013253, 209, 209, 0x00010000, 0x00b9523000, 3, 0, 0, 0, 0, 0, System ( 4), 0, C:\kernel.etl DiskWrite, 368013304, 368013686, 382, 382, 0x00010000, 0x00b9533000, 3, 0, 0, 0, 0, 0, System ( 4), 0, C:\kernel.etl DiskWrite, 368013728, 368013905, 177, 177, 0x00010000, 0x00b9543000, 3, 0, 0, 0, 0, 0, System ( 4), 0, C:\kernel.etl DiskWrite, 368013947, 368014301, 354, 354, 0x00010000, 0x00b9553000, 3, 0, 0, 0, 0, 0, System ( 4), 0, C:\kernel.etl DiskWrite, 368014344, 368014517, 173, 173, 0x00010000, 0x00b9563000, 3, 0, 0, 0, 0, 0, System ( 4), 0, C:\kernel.etl DiskWrite, 368014563, 368014738, 175, 175, 0x00010000, 0x00b9573000, 3, 0, 0, 0, 0, 0, System ( 4), 0, C:\kernel.etl DiskWrite, 368014782, 368014958, 176, 176, 0x00010000, 0x00b9583000, 3, 0, 0, 0, 0, 0, System ( 4), 0, C:\kernel.etl
|
也可以用 -overlap 命令获得IO们的 overlap 信息.
Summary
这里介绍了一些很基本的使用, 使用是一个很简单的事情, 重要的是如何一点点的找到思路,做哪些检测,然后来找到问题, 后面应该会结合一些实际案例来讲解一下 performance tuning 的思路.
呼呼呼山
2020-06-16 19:06:00